PixelFlux modules: the analysis module
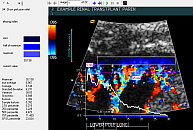
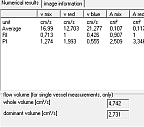
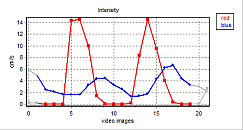
The analysis module displays the results of the perfusion examination: flow velocity, perfused area, the resulting intensity as well as, for examinations of single vessels, the flow volume. These parameters are displayed in charts. All parameters are divided into two flow directions according to the color information in the video (red and blue). For each unit PixelFlux calculates the resistance index (RI) and pulsatility index (PI). Moreover PixelFlux automatically calculates the period of these parameters corresponding to the heart cycle. So the average is truly the average of one heart period.
All perfusion results, charts and the ROI of the current examination can be exported. You can print a finding, which contains all charts and perfusion results. However, PixelFlux does not itself formulate a medical diagnosis.
| Versions | Standard | Professional | Scientific |
|---|---|---|---|
| Main module | x | x | x* |
| Analysis module | x | x | x |
| Database module | x | x* |
